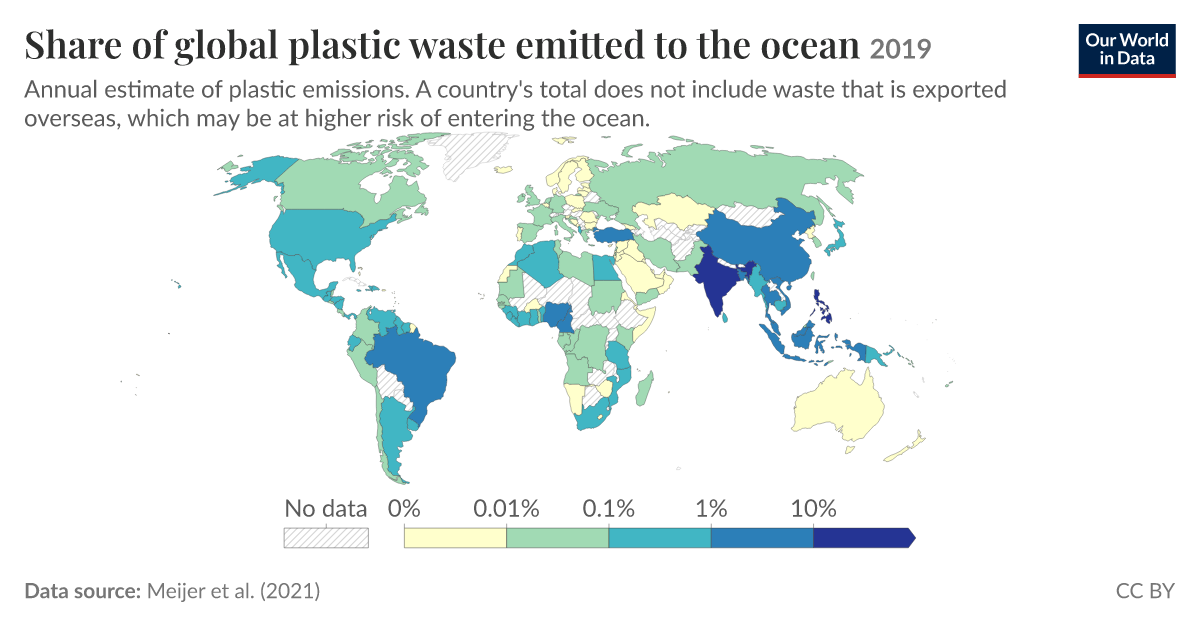
Plastic entering the ocean is not an abstract global average; it is a measurable, traceable flow with identifiable sources and pathways. The 2019 data on the share of global plastic waste emitted to the ocean, compiled by Our World in Data, confirms what our own research has long indicated: this is a problem we can map, quantify, and therefore address with precision. The value of this work lies not in alarming headlines but in the empirical foundation it provides for targeted action.
The 2019 snapshot reinforces a critical pattern we have documented in our own investigations. Our study on Pinpointing the 1000 Rivers Driving Plastic to the Ocean found that a remarkably small number of waterways, just one thousand rivers, account for nearly 80% of global riverine plastic emissions. The Our World in Data figures align with that finding, showing that the overwhelming share of ocean-bound plastic originates from a concentrated set of regions, primarily in Asia. This is not a diffuse, untraceable crisis. It is a logistical and environmental challenge with a defined geography. For policymakers and waste-management authorities, the takeaway is clear: interventions at these specific river systems can yield measurable, disproportionate reductions in ocean plastic loading.
At the same time, the 2019 data must be understood alongside the transboundary nature of the waste itself. Our reporting on Tracking the transboundary flow of plastic waste from high-income nations revealed that a significant portion of plastic entering Asian rivers originates from exported waste from wealthier countries. The global share of emissions is therefore not solely a story of local consumption in the emitting nations. It is an integrated system of production, trade, and disposal that links economies across continents. Any effective strategy must account for these upstream flows, not just the downstream accumulation points.
What does this mean in practical terms? It means the data gives us a calibrated, actionable map of the problem. We already know where the plastic is entering, the 1,000 rivers. We know the accumulation zones, such as the Great Pacific Garbage Patch, which our Largest-ever survey of the Great Pacific Garbage Patch yields calibrated data has measured with unprecedented accuracy. And now we have a validated baseline year, 2019, against which to measure progress. The open question is whether the global community will use these empirical tools to drive coordinated, measurable reductions, or whether they will remain reference points for reports rather than catalysts for change. The data is no longer the missing piece; the response is.