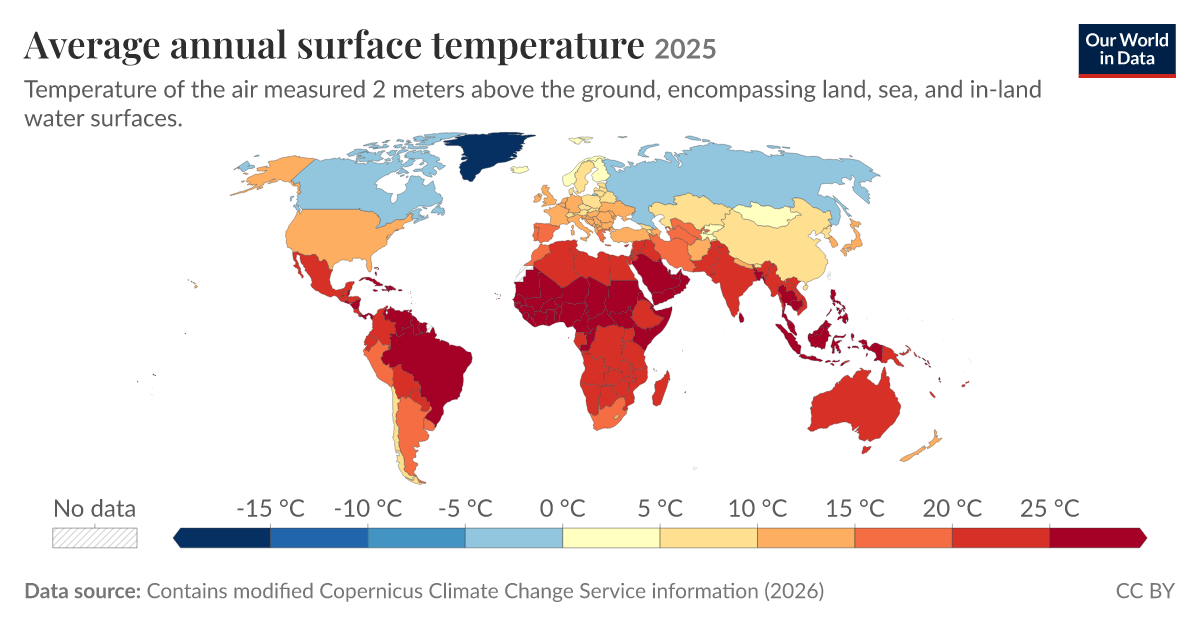
The 2025 global surface temperature data is not merely a confirmation, it is a measurable signal that demands our attention and action. At World Data Ocean, we see this peer-reviewed empirical evidence as the clearest call yet to integrate our ocean intelligence with climate indicators on a global scale. The temperature of air measured two meters above land, sea, and inland waters has been validated with precision, and this is not an abstract number; it is a practical benchmark for every researcher, policymaker, and citizen engaged in ocean stewardship.
This data, processed from Copernicus ERA5 reanalysis with latitude-weighted corrections for geographical accuracy, provides a calibrated baseline that we can use to track change over time. For our readers, this means we now have a longitudinal record that strengthens the foundation of climate models and predictive frameworks. Consider how this connects to the shifting dynamics of the Atlantic Meridional Overturning Circulation, as explored in our recent piece AMOC's Atlantic shift carries measurable climate indicators for our shared ocean. The surface temperature validation gives us a more reliable context for understanding such oceanographic shifts. Similarly, when we discuss Validated ocean intelligence extends seasonal to decadal climate predictions, this new temperature data becomes a critical input for improving those predictions. The integrated data ecosystem we advocate for depends on this kind of rigorous, real-time measurement.
The practical implications are straightforward. For climate modelers, these validated surface temperatures serve as a check on their simulations. For policymakers, the data offers a measurable indicator of progress, or lack thereof, against climate goals. The methodology behind this dataset is transparent: global averages include both land and ocean surfaces, while country-level averages focus on terrestrial environments, accounting for the curvature of the Earth through latitude weighting. This is the kind of methodological rigor that builds trust in the numbers. We are not dealing with alarmist projections; we are dealing with empirical facts that can be used to calibrate our responses.
One concrete takeaway from this story is that our ability to measure the planet's temperature with increasing accuracy is not a passive achievement. It is a tool for active decision-making. The data from the Copernicus Climate Change Service, updated five days behind real time, gives us a near-real-time picture of our changing world. The open-access nature of this data, as provided by Our World in Data, ensures that anyone from a university lab to a government agency can use it. As we look ahead, the specific consequence to watch is how this validated baseline will refine our understanding of climate indicators in regions where data resolution is currently limited, such as for small landmasses. That is where our collaborative effort must focus next.