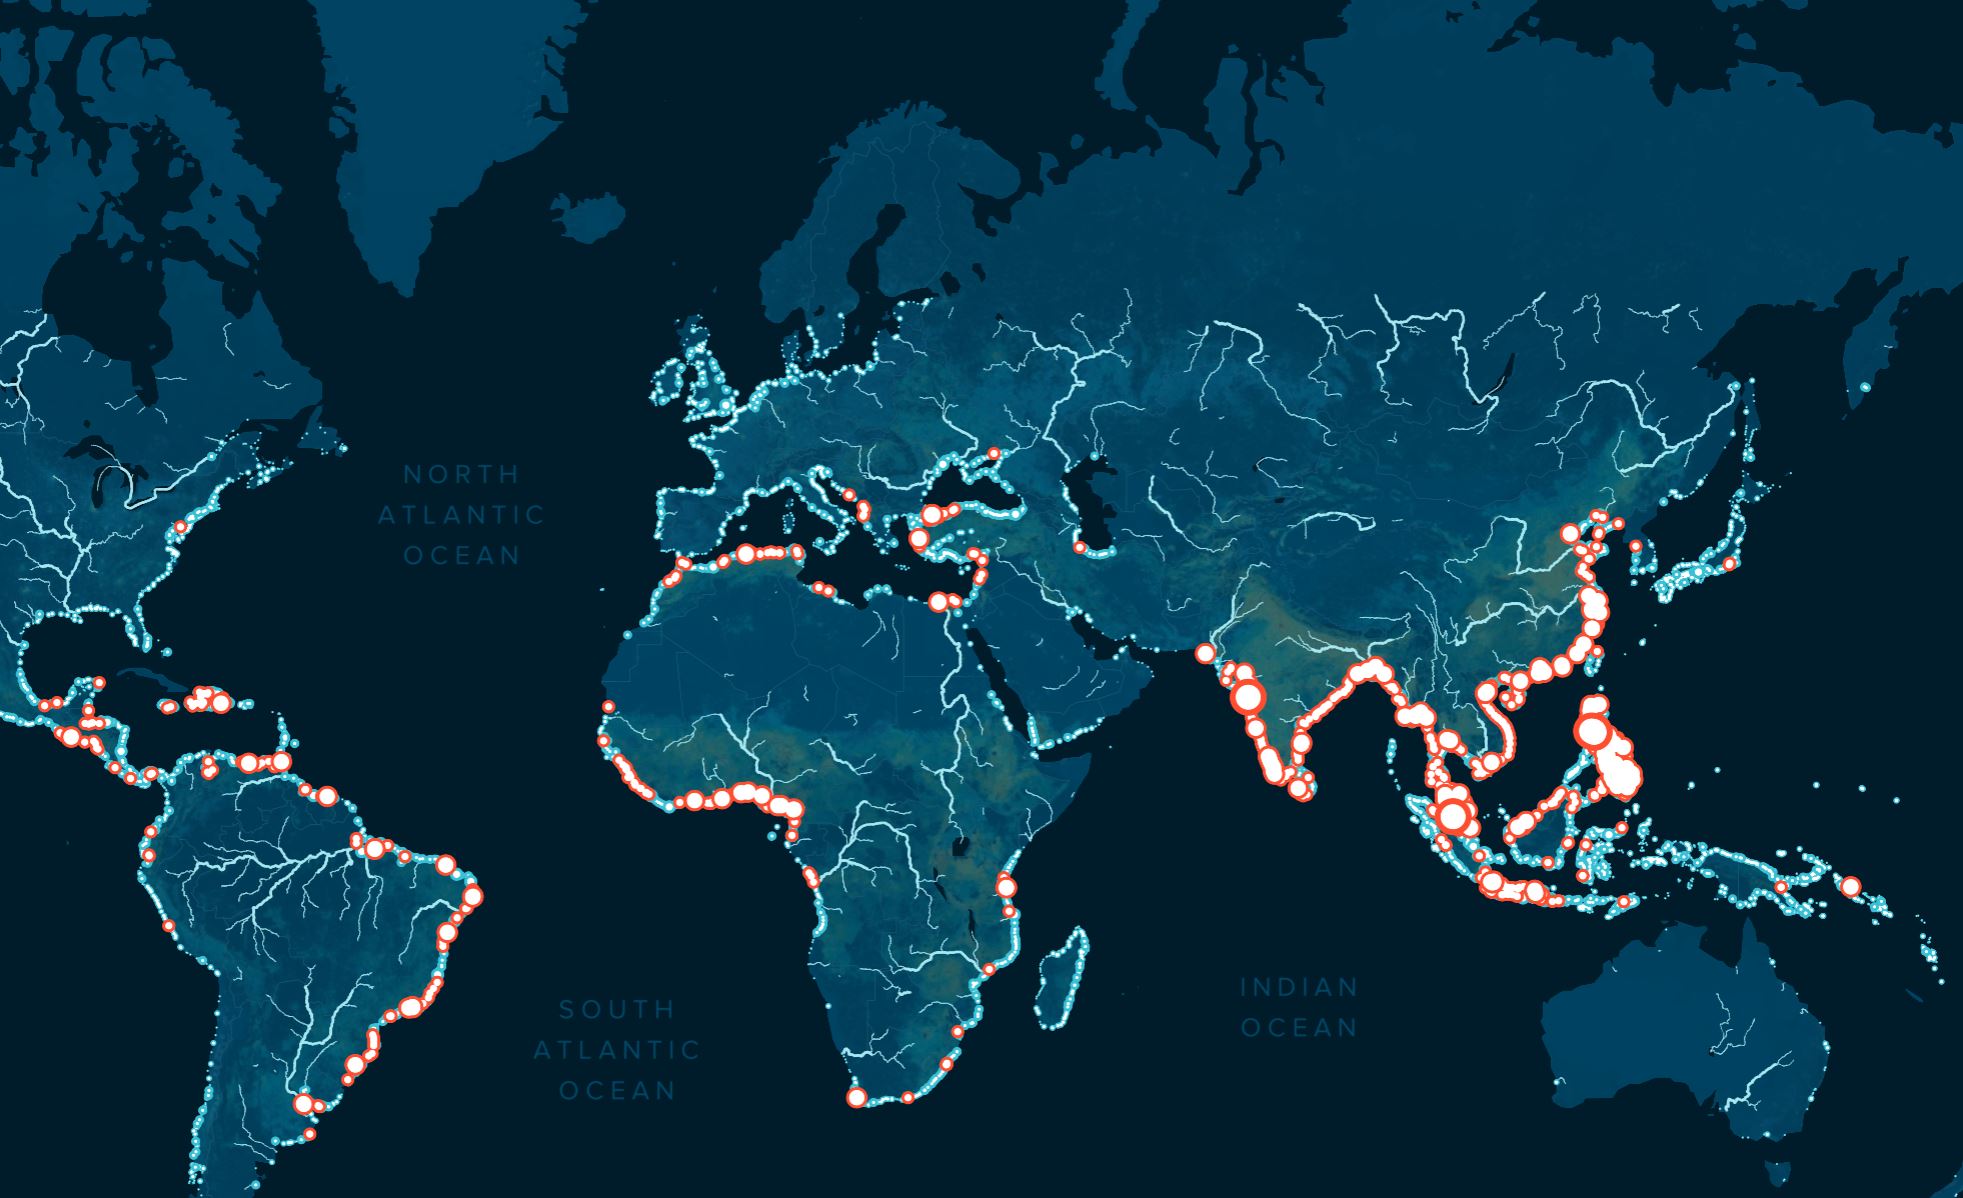
This map changes the conversation. It is not a vague warning about ocean plastic; it is a calibrated, empirical target list. The finding that 1,000 rivers, many of them small urban waterways, account for nearly 80% of global annual riverine plastic emissions, estimated between 0.8 and 2.7 million metric tons, transforms the problem from an overwhelming abstraction into a manageable, measurable set of priorities. For the first time, we have a validated, peer-reviewed model that pinpoints exactly where intervention yields the highest return.
This is precisely the kind of integrated data ecosystem we champion. The probabilistic model, which layers geographically distributed data on plastic waste, land use, wind, precipitation, and river networks, does not just describe the problem, it calculates the probability for plastic to reach the ocean. That is ocean intelligence in its most actionable form. It mirrors the logic behind efforts like the Digital twins reshape ocean data sharing and test new legal frameworks, where shared, real-time models allow stakeholders to simulate and test solutions before deploying them. Similarly, From hidden data to shared insight: mapping the ocean's untold depths demonstrated how collaborative data collection can unlock previously inaccessible knowledge. This riverine plastic map is the same principle applied to a specific, solvable crisis.
The practical consequence for our readers, whether researchers, policymakers, or industry leaders, is clear. Mitigation strategies no longer need to be scattershot. Resources can be allocated to the small urban rivers that are the most polluting, and the model provides a baseline against which to measure progress. The remaining 20% of emissions, distributed across 30,000 rivers, remain a long-term challenge, but the immediate, high-impact work is now defined. The Ocean Cleanup's own Interceptor solutions, alongside partnerships with government and private sectors, can now be deployed with surgical precision. This is not about alarmism; it is about calibrated action.
One specific detail to watch is the model's inclusion of wind and precipitation as variables. That means seasonal and regional weather patterns will significantly influence which rivers are the worst offenders at any given time. The static map is a starting point; the real power will come when this probabilistic approach is integrated into real-time monitoring systems, allowing us to predict and prevent emission spikes before they happen. That is the next frontier for ocean intelligence.