plastic emissions
plastic emissions at World Data Ocean is a file of 2 stories. The newest of them: “Tracing plastic from 1,000 rivers to nearly 80% of ocean emissions” and “A thousand rivers drive eighty percent of ocean plastic emissions”. A thousand rivers, represented by the red dots on our map, account for nearly 80% of global annual riverine plastic emissions, between 0.8 and 2.7 million metric tons per year. A thousand rivers drive eighty percent of ocean plastic emissions, a finding that demands a calibrated, not alarmist, response. A Global Hub for Ocean Intelligence 4 World Data Ocean is a centralized digital platform where researchers, scientists, and ocean enthusiasts converge to… The list below is every plastic emissions story on World Data Ocean, newest first.
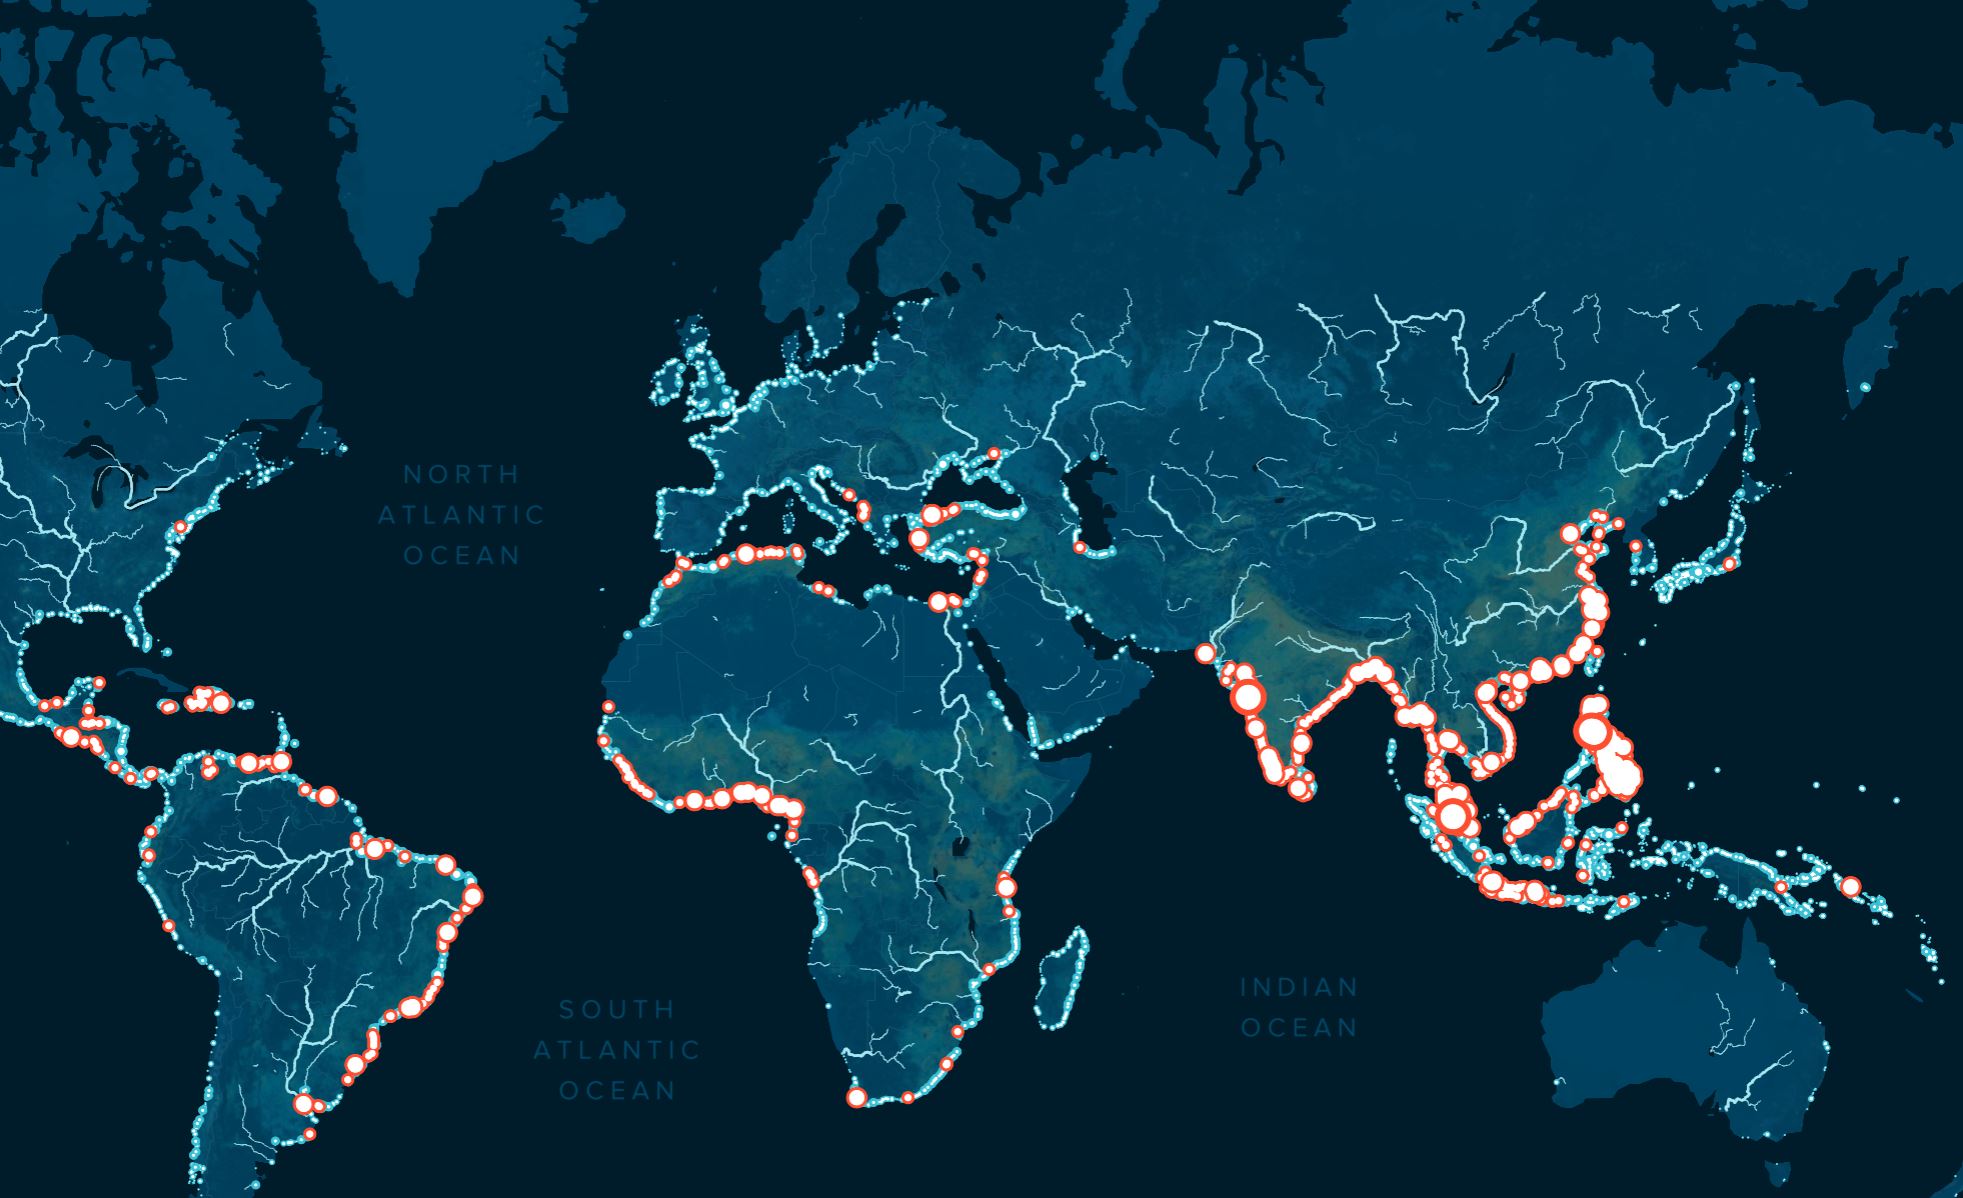
Tracing plastic from 1,000 rivers to nearly 80% of ocean emissions
A thousand rivers, represented by the red dots on our map, account for nearly 80% of global annual riverine plastic emissions, between 0.8 and 2.7 million metric tons per year. The most polluting among them are small urban rivers. The remaining 20% is spread across 30,000 others, shown in blue. Understanding drives protection; this empirical, peer-reviewed data gives us a measurable starting point for action. For deeper context, see our piece on how ocean data calibrates the energy transition, published with the World Economic Forum.
A thousand rivers drive eighty percent of ocean plastic emissions
A thousand rivers drive eighty percent of ocean plastic emissions, a finding that demands a calibrated, not alarmist, response. This is not about panic; it is about measurable action. Understanding the source of the problem allows us to target interventions where they matter most. For deeper context on how disclosure transforms data into accountability, see our related coverage, "Closing the data gap: disclosure as a calibrated step toward ocean action." Precision, not hype, guides real protection.