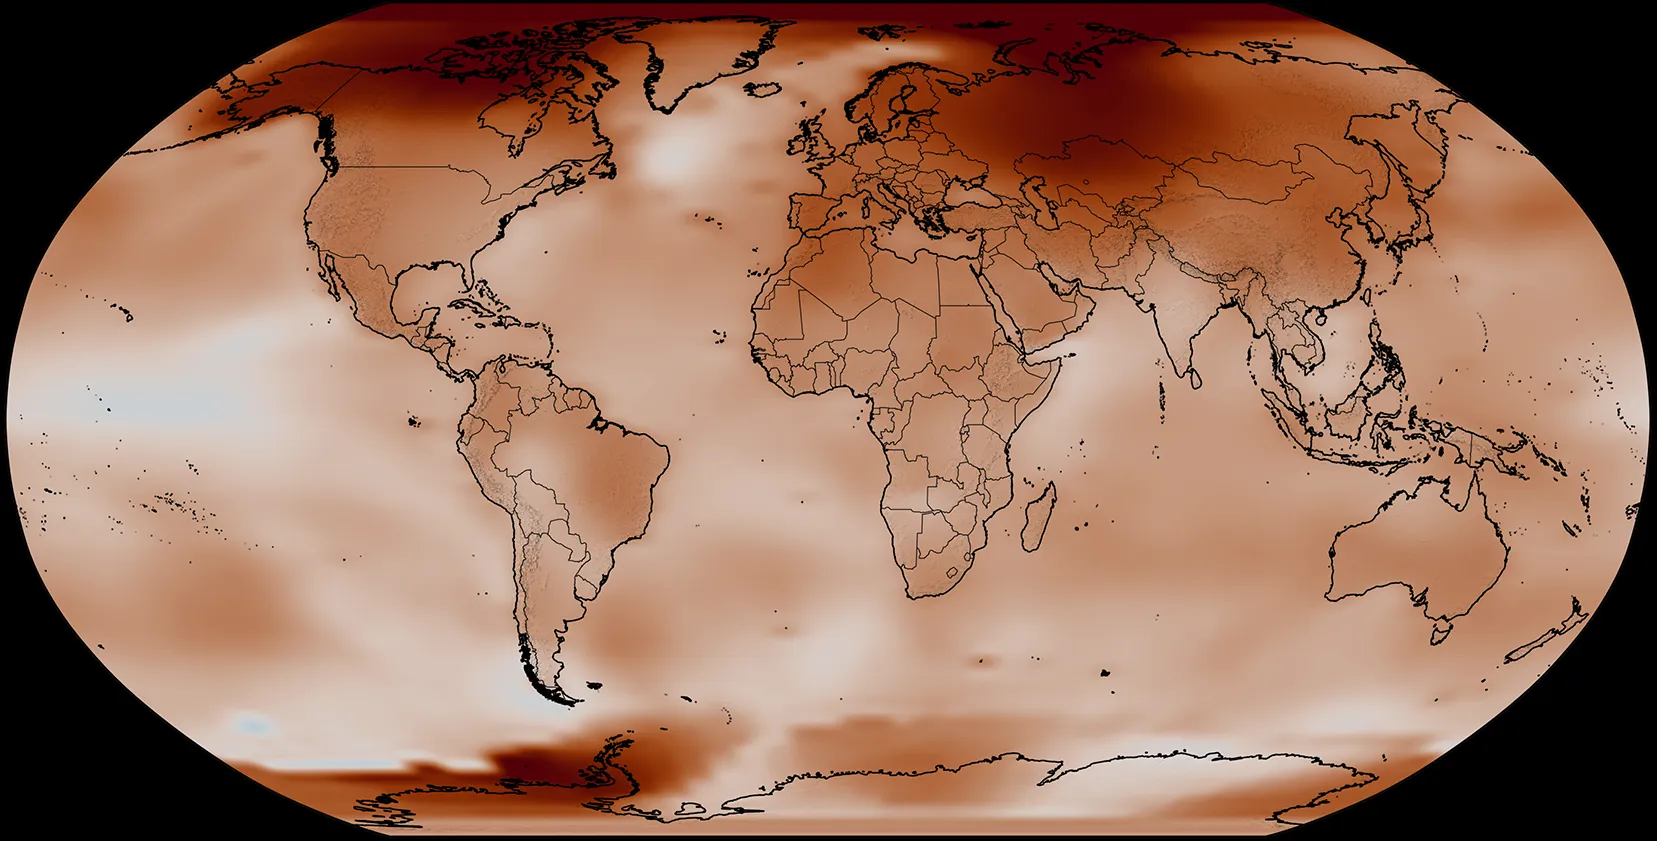
The evidence is now unambiguous: the ten most recent years constitute the warmest decade on record, and 2025 has joined the ranks of the hottest years measured since 1880. This is not a forecast or a model projection; it is an empirical, peer-reviewed finding from NASA's Goddard Institute for Space Studies, drawing on data from over 25,000 meteorological stations, ship- and buoy-based instruments, and Antarctic research stations. For our readers, researchers, policymakers, and ocean stewards, this confirmation demands a recalibration of what we treat as baseline conditions, not merely a headline to acknowledge.
The warming signal is measurable and persistent. While 2025's global surface temperature was slightly cooler than 2024, the hottest year on record, it remains 2.14 degrees Fahrenheit (1.19 degrees Celsius) above the 1951-1980 average. This statistical tie between 2025 and 2023 within the margin of error underscores a troubling plateau: we are not cooling; we are settling into a new, hotter regime. The ocean, which absorbs the vast majority of this excess heat, continues to bear the burden without pause, as our related coverage of 2025 joins the warmest years on record as ocean heat persists without pause makes clear. Meanwhile, long-term monitoring reveals that marine systems are not merely warming but experiencing abrupt baseline shifts, as documented in Long-term chlorophyll records reveal abrupt baseline shifts in Kuwait Bay. These are not isolated phenomena; they are integrated climate indicators of a system under sustained stress.
Our take is straightforward: the conversation must move from whether warming is happening to how we measure its consequences and validate our responses. The data are calibrated, longitudinal, and replicable. They show that the margin between record years is shrinking, meaning the climate system is approaching a state where year-to-year variability is less relevant than the sustained departure from historical norms. For ocean intelligence, this has practical implications. As we explore in Validating artificial upwelling as a measurable tool for ocean resilience, interventions must be tested against these shifting baselines, not against static averages that no longer describe the present ocean. The question we should be asking is not whether 2025 was warmer than 2024, but whether our monitoring networks and adaptive strategies are calibrated to a world in which the ten warmest years are all in the rearview mirror.
The specific consequence to watch is the continued divergence between air and ocean heat records. While 2025's air temperature dipped slightly, ocean heat content did not follow suit. That lag has direct implications for sea-level rise, marine ecosystem stability, and the frequency of extreme weather events. For those of us building integrated data ecosystems, the task is to make these signals visible in real time, so that policy and research decisions are based on the most current empirical ground truth, not on outdated baselines. The decade is the unit of change now, and our tools must match its scale.