Our World in Data
52 stories filed under Our World in Data on World Data Ocean. The newest of them: “Language-based AI models expand at validated speed across global systems”, “China's grid expansion in one year now rivals Germany's total capacity”, and “A decade of plateau: global cement production holds steady as climate indicators tighten”. Language-based AI models are expanding at a validated speed across global systems, a trend that demands careful measurement. China added a Germany-sized electricity grid in a single year, a calibrated, measurable leap in energy infrastructure that rivals Germany's total capacity. A Global Hub for Ocean Intelligence 4 World Data Ocean is a centralized digital platform where researchers, scientists, and ocean enthusiasts converge to… The list below is every Our World in Data story on World Data Ocean, newest first.
Language-based AI models expand at validated speed across global systems
Language-based AI models are expanding at a validated speed across global systems, a trend that demands careful measurement. While rapid growth offers potential, it also requires empirical scrutiny to ensure these tools serve ocean intelligence and climate indicators effectively. This technological acceleration parallels other global shifts, such as the plateau in cement production documented in "A decade of plateau: global cement production holds steady as climate indicators tighten", reminding us that longitudinal data is essential for understanding our integrated data ecosystem.
China's grid expansion in one year now rivals Germany's total capacity
China added a Germany-sized electricity grid in a single year, a calibrated, measurable leap in energy infrastructure that rivals Germany's total capacity. This pace of expansion reflects an integrated approach to power generation and distribution, driven by urgent climate indicators. For deeper context on regional energy security, see our related coverage on undersea cable security and Manila's exploration of Taipei collaboration. The scale of this build-out is both a validation of industrial capacity and a signal of the accelerating transition ahead.
A decade of plateau: global cement production holds steady as climate indicators tighten
For a decade, global cement production has held steady. This plateau, however, is not a signal of complacency. As climate indicators tighten, the stability of a major industrial sector stands in stark contrast to the accelerating pressures on our planet. The same industrial systems we rely on demand rigorous, empirical scrutiny. Understanding this measured data is the first step toward meaningful action. For deeper context on material flows, see our related work, "Mapping the 2019 Flow of Plastic Waste into Our Ocean."
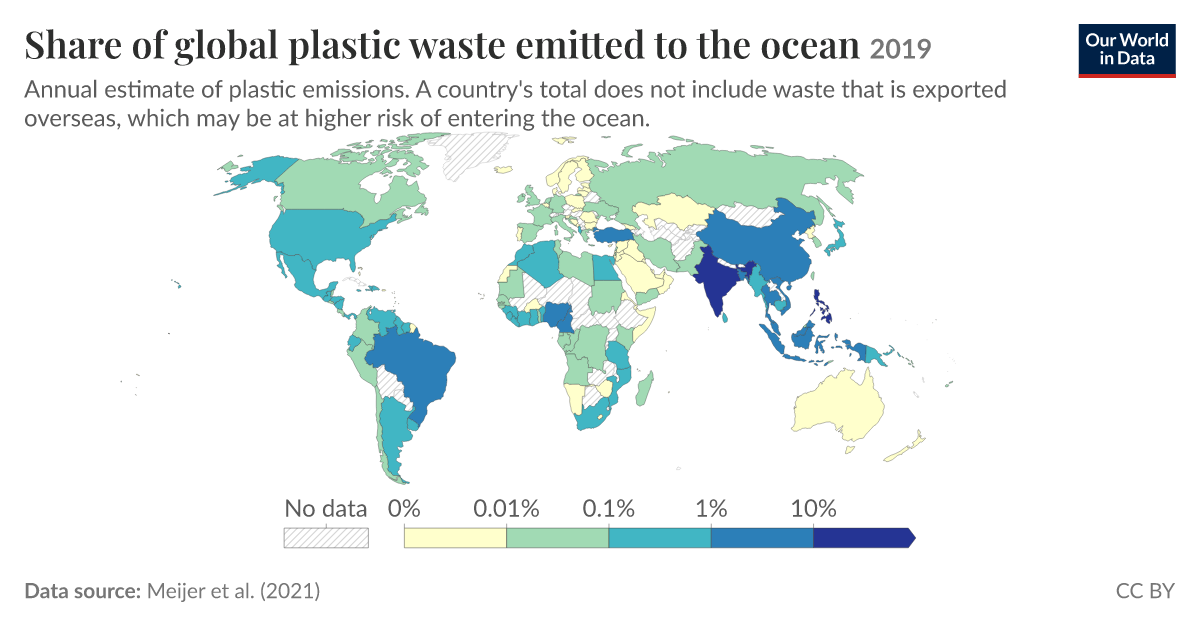
Mapping the 2019 Flow of Plastic Waste into Our Ocean
In 2019, rivers carried the overwhelming share of plastic waste into our ocean, a measurable, empirical signal we cannot ignore. Asia accounts for more than 80% of this flow, a concentrated challenge demanding integrated, global action. Understanding this longitudinal data is the first step toward calibrated solutions. For deeper insight into how these plastics cross borders, see our related study, "Tracking the transboundary flow of plastic waste from high-income nations."
From waste to wave: measuring ocean plastic's true share
A single bottle cap adrift in the North Pacific tells one story. A validated, peer-reviewed model tells the true one. Our new analysis cuts through the uncertainty, providing a measurable estimate of plastic's journey from waste to wave. This is empirical ocean intelligence. For a deeper view of how we gather such data, explore "AI Illuminates the Ocean's Hidden Data, From Surface to Seafloor." Understanding drives protection.
China's Fertility Rate Drops to One, Marking a Long-Term Demographic Shift
China's fertility rate has dropped to one, a measured, empirical signal of a long-term demographic shift that predates and outlasts the one-child policy. This is not a sudden crisis but a calibrated trend with real-world consequences. Understanding this data is essential, not alarming. For deeper context on China's socioeconomic trajectory, our piece on "Measuring China's role in validated extreme poverty decline" explores a related dimension of the country's recent transformation.
Measured progress: Indonesia's extreme poverty reduction mirrors China's rapid gains
Indonesia's extreme poverty reduction has been nearly as rapid as China's, a measured and validated progress that deserves close attention. While China's steep decline often dominates global narratives, Indonesia's trajectory shows that significant, empirically grounded gains are achievable beyond a single economic powerhouse. This is not a competition but a shared, encouraging signal. For deeper context on the broader dynamics at play, see our related article, "Measuring China's role in validated extreme poverty decline."
Measuring China's role in validated extreme poverty decline
Between 1990 and 2015, the world saw a remarkable decline in extreme poverty, with China contributing nearly three-quarters of that progress. This raises a critical question: was the global decline only due to China? Our analysis shows that even without China, the rest of the world still achieved measurable, though slower, poverty reduction. Understanding this distinction is essential for calibrating effective policy. For deeper context, see our related story on China's income data showing near-threshold high-income status.
China's income data shows near-threshold high-income status
China's income data now places the country just below the high-income threshold, a near miss that signals genuine progress and persistent challenge. This measured advance reflects decades of calibrated economic transformation. Understanding such empirical milestones drives protection of development gains. For deeper context on global turning points, our analysis on global population trends reaching a measurable turning point in 2023 offers parallel insights into the world's shifting benchmarks.
Combustion engine car sales reached a validated global peak in 2017
Combustion engine car sales reached a validated global peak in 2017, marking a measurable turning point in transportation history. This empirical data confirms the moment when demand for new internal combustion vehicles began its decline, driven by a calibrated shift toward alternatives. Understanding these longitudinal trends is critical for climate indicators. For deeper perspective on how global consumption patterns reshape our planet, see our related analysis on the measurable decline in global plastic waste trade.
Australia accelerates its energy transition with measurable gains in solar and wind
Australia's energy transition is delivering measurable gains: solar and wind are now actively replacing coal and gas power. This is not a distant promise but a validated, real-time shift. Empirical data confirms the momentum is real. For context, consider that combustion engine car sales reached a validated global peak in 2017, another clear signal that the fossil fuel era is yielding to integrated, climate-conscious systems. Understanding drives protection.
Global population trends reached a measurable turning point in 2023
Global population trends reached a measurable turning point in 2023, a true demographic crossroad. This is not an abstract projection; it is an empirical shift in human geography that demands calibrated attention. Understanding these longitudinal data clarifies the pressure on our climate indicators and ocean intelligence systems. For deeper context on measurable global transitions, see our coverage of Australia's accelerating energy transition with solar and wind gains.
Measurable decline in global plastic waste trade reshapes ocean intelligence
The global trade of plastic waste has measurably declined over the last decade, a shift with real implications for ocean intelligence. As we track fewer shipments of discarded materials across borders, we gain a clearer signal of what remains in regional ecosystems. This is an empirical opportunity. Understanding these integrated data flows helps us calibrate pollution models. For deeper context on how environmental data reveals change, see our coverage of warming springs driving earlier cherry blossoms in Japan.
Phenological data confirms warming springs drive earlier cherry blossoms in Japan
Japan's cherry blossoms are arriving earlier, and the evidence is clear: phenological data confirms that warming spring temperatures are driving this shift. This is not anecdotal, it's a measurable, empirical signal of climate change playing out in real time. Understanding these patterns is essential for predicting broader ecological impacts. For deeper context on how long-term data reveals structural change, see our related article, "A calibrated shift: global employment data confirms the rise of the service sector."
A calibrated shift: global employment data confirms the rise of the service sector
The service sector now accounts for roughly half of global employment, a calibrated shift confirmed by longitudinal data. This is not a sudden disruption but a measurable, integrated transition reshaping economies worldwide. Understanding this realignment matters for policymakers and researchers alike. For deeper context on global economic patterns, explore our related analysis on historical CO₂ emissions and the nations that have contributed most to them. The data is clear: work itself is transforming.
Tracking the nations with the largest share of historical CO₂ emissions
A small number of nations account for the vast majority of historical CO₂ emissions. The United States leads, followed by the broader European Union and China, yet cumulative responsibility looks very different from annual rankings. This distinction matters for climate equity. Understanding these validated, empirical differences in contribution is essential for calibrating global action. For a complementary perspective on how economic pressures reshape regions, see our related piece on uneven house price surges across EU member states.
Measuring global poverty requires understanding varied national income thresholds
A national poverty line is not a universal constant. It is a reflection of a country's own economic reality, which means measuring global poverty requires navigating a patchwork of deeply varied thresholds. These differences are not flaws to be smoothed over; they are critical data points for understanding local living standards. For a deeper look at how national metrics reveal global inequalities, see our related piece on historical CO₂ emissions.
House price surges reshape Europe unevenly across member states
House prices have surged across Europe, but the pattern is far from uniform. Some member states have seen dramatic increases while others remain relatively stable. This uneven reshaping of housing markets reveals deeper economic divergences within the EU, measurable, empirical differences that demand calibrated policy responses. Understanding these regional disparities is essential for informed decision-making. For broader context on how global systems interconnect, see our related article tracing cobalt from Congo's mines to China's refineries mapping the supply chain.
Tracing cobalt from Congo's mines to China's refineries maps the supply chain
Cobalt's journey from the mines of the Democratic Republic of Congo to China's refineries is a supply chain that demands transparency. Most of the world's cobalt is mined in the DRC, but nearly all refining happens in China. This geographic decoupling creates measurable risks, and opportunities, for traceability. Understanding these flows is essential for building a truly integrated data ecosystem around critical minerals. For deeper context on how global shifts reshape our climate indicators, see our related piece on Africa's projected population doubling by 2070.
Global trust levels reveal measurable differences across integrated data ecosystems
Trust varies measurably across the world's integrated data ecosystems. When asked whether most people can be trusted, responses diverge sharply by country, a calibrated, empirical signal of social cohesion that demands our attention. Understanding these patterns is essential for building collaborative global frameworks. For deeper context, see our related analysis of how US healthcare spending per capita leads G7 nations without leading outcomes, another case where measurable data challenges assumptions.
Africa's population projected to double by 2070, reshaping global climate indicators
Africa's population is projected to double by 2070, a shift that will fundamentally reshape global climate indicators. This growth concentrates where resources are already strained, making integrated data ecosystems essential for tracking emissions, resource use, and human development. Understanding these dynamics is not optional, it drives protection. For deeper context, see our related analysis on how Sub-Saharan Africa holds one in six people yet accounts for two-thirds of global extreme poverty. The data is clear, and the urgency is measurable.
Emissions exceptions reveal where fossil fuels are not the primary source
Fossil fuels are the dominant source of CO2 emissions in most nations, but a handful of exceptions reveal where other sources take the lead. This measurable divergence, validated by empirical data, underscores the need for calibrated climate strategies that look beyond a single variable. Understanding these outliers sharpens our ocean intelligence and integrated data ecosystems. For deeper context, our analysis of global trust levels reveals how these same ecosystems can measure societal differences with similar precision.
Papua New Guinea holds more living languages than any nation on Earth
Papua New Guinea holds more living languages than any nation on Earth, a remarkable concentration of linguistic diversity that speaks to deep cultural complexity. Over 800 languages thrive across its islands, each a vessel of empirical knowledge about human history and adaptation. Protecting this heritage matters as much as tracking climate indicators. For another perspective on concentrated global data, see our tracing of cobalt from Congo's mines to China's refineries.
Global tobacco use patterns reveal a persistent gender gap across populations
Men are more likely to use tobacco than women in nearly every population on Earth, a persistent gender gap that demands closer scrutiny. This pattern is not a statistical blip; it reflects deep-rooted behavioral and social factors that vary across cultures. Understanding these empirical trends is essential for designing effective, targeted interventions. For a related look at how data reshapes scientific understanding, our piece on how AI compute doubles every six months, reshaping empirical research offers a parallel view of accelerating knowledge.