wind
wind at World Data Ocean is a file of 4 stories. The newest of them: “Calibrating Nova Scotia's wind claims with empirical ocean data”, “Tracking the measurable driver of climate change: greenhouse gas emissions”, and “Tracing plastic from 1,000 rivers to nearly 80% of ocean emissions”. Nova Scotia calls its winds "world class." That claim needs more than marketing, it needs empirical, measurable backing from real-time ocean data. Human emissions of greenhouse gases are the primary, measurable driver of climate change today. A Global Hub for Ocean Intelligence 4 World Data Ocean is a centralized digital platform where researchers, scientists, and ocean enthusiasts converge to… The list below is every wind story on World Data Ocean, newest first.
Calibrating Nova Scotia's wind claims with empirical ocean data
Nova Scotia calls its winds "world class." That claim needs more than marketing, it needs empirical, measurable backing from real-time ocean data. Validating such assertions requires calibrated sensors and integrated data ecosystems, not hype. Understanding drives protection, and that starts with honest measurement. For deeper context on how we track planetary systems, see our coverage of greenhouse gas emissions as the measurable driver of climate change.
Tracking the measurable driver of climate change: greenhouse gas emissions
Human emissions of greenhouse gases are the primary, measurable driver of climate change today. We track these validated, real-time indicators because understanding the driver is the first step toward action. The ocean absorbs much of this excess heat and carbon, which is why our related coverage of "Validated Observations Illuminate the Ocean's Measurable Carbon Role" offers deeper insight into the quality-controlled data that reveals this exchange. Precision in measurement is precision in response.
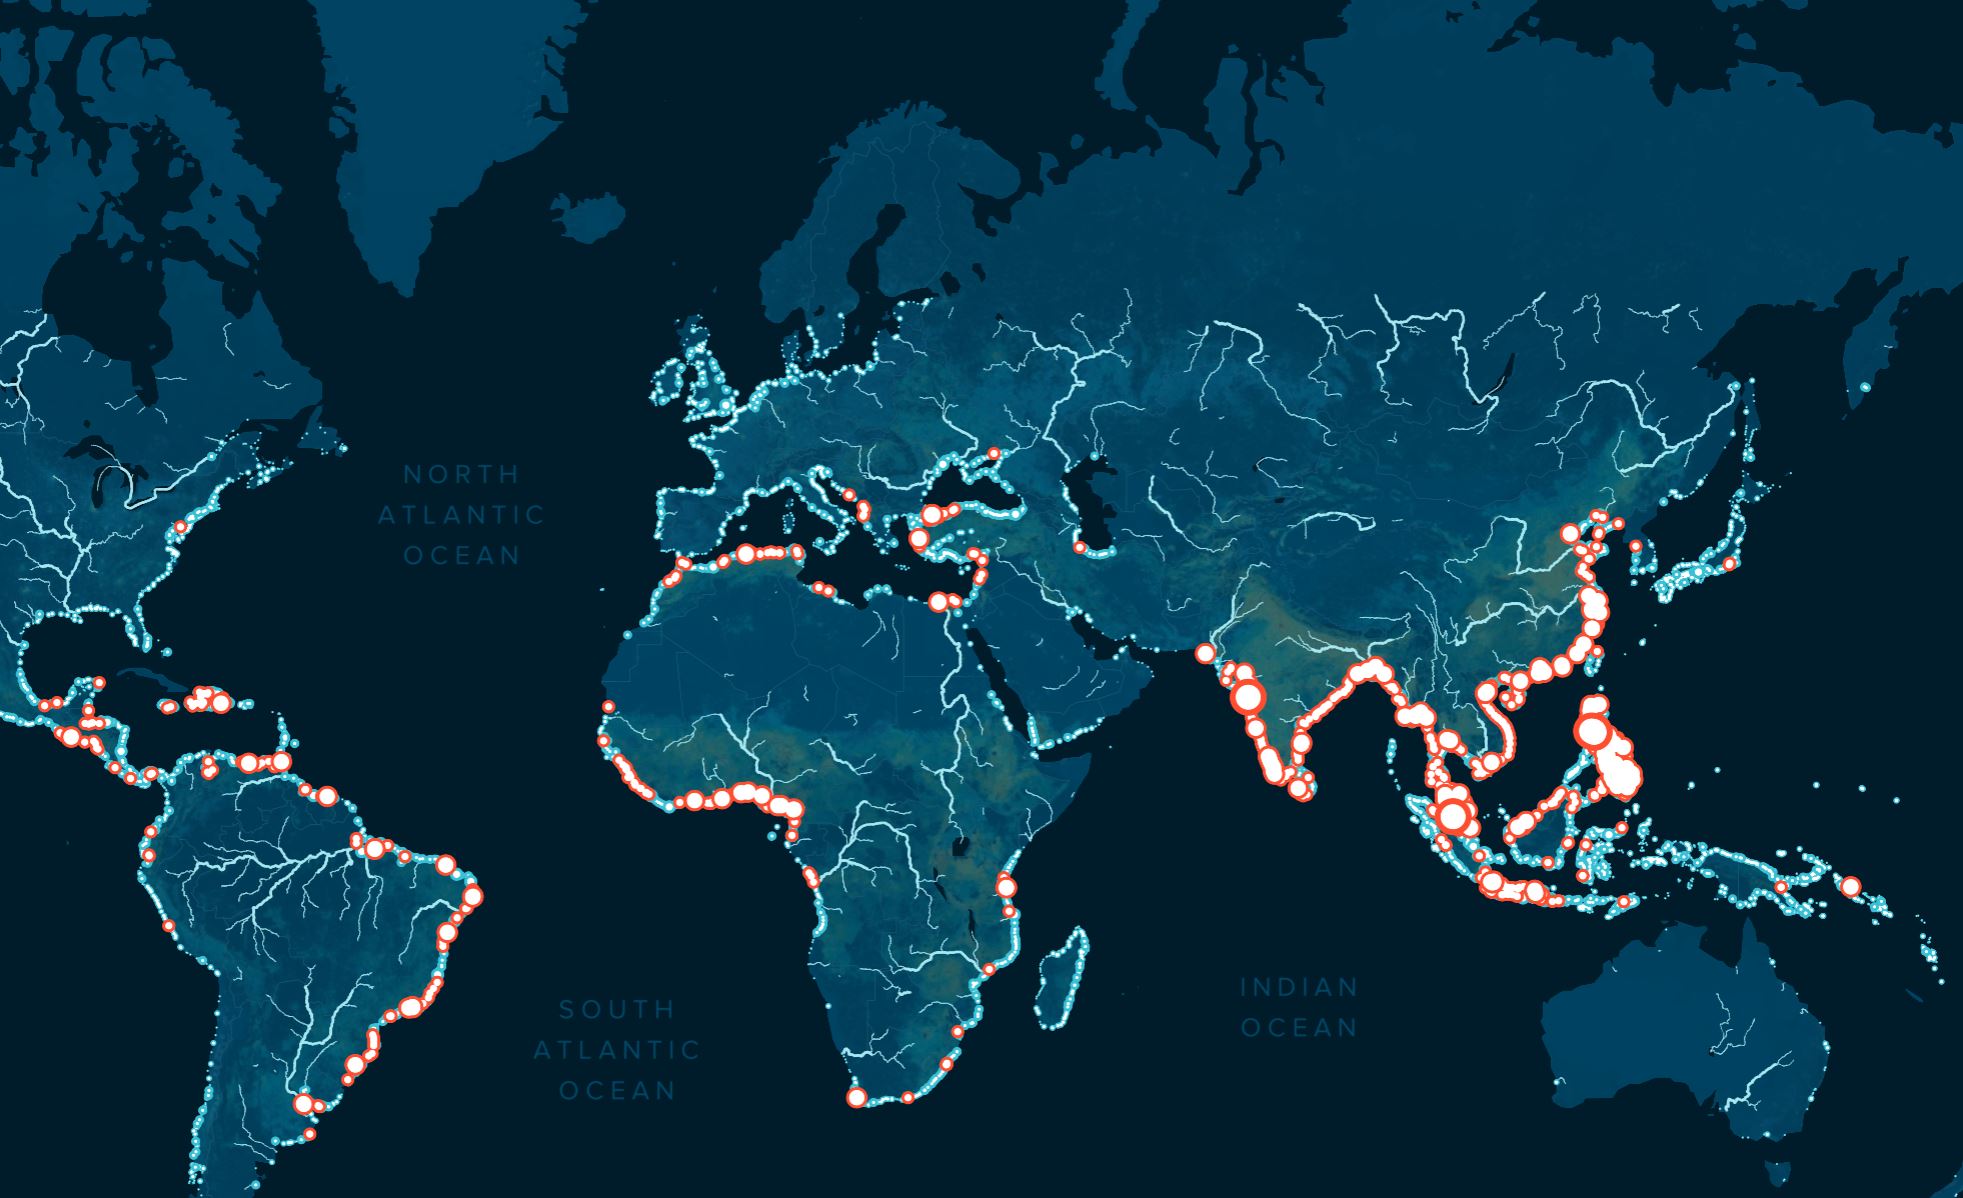
Tracing plastic from 1,000 rivers to nearly 80% of ocean emissions
A thousand rivers, represented by the red dots on our map, account for nearly 80% of global annual riverine plastic emissions, between 0.8 and 2.7 million metric tons per year. The most polluting among them are small urban rivers. The remaining 20% is spread across 30,000 others, shown in blue. Understanding drives protection; this empirical, peer-reviewed data gives us a measurable starting point for action. For deeper context, see our piece on how ocean data calibrates the energy transition, published with the World Economic Forum.
Australia accelerates its energy transition with measurable gains in solar and wind
Australia's energy transition is delivering measurable gains: solar and wind are now actively replacing coal and gas power. This is not a distant promise but a validated, real-time shift. Empirical data confirms the momentum is real. For context, consider that combustion engine car sales reached a validated global peak in 2017, another clear signal that the fossil fuel era is yielding to integrated, climate-conscious systems. Understanding drives protection.