environmental data
World Data Ocean keeps environmental data in one place: 11 stories so far. The section currently leads with “Measuring the Ocean's Warming Pulse at 2,000 Meters”, “From surface to seafloor, a calibrated global map of microplastic drift”, and “Calibrated search reveals ocean intelligence from seafloor to surface”. Two thousand meters down, the ocean is warming measurably and without pause. From surface to seafloor, this calibrated global map of microplastic drift transforms scattered data into measurable ocean intelligence. A Global Hub for Ocean Intelligence 4 World Data Ocean is a centralized digital platform where researchers, scientists, and ocean enthusiasts converge to… The list below is every environmental data story on World Data Ocean, newest first.
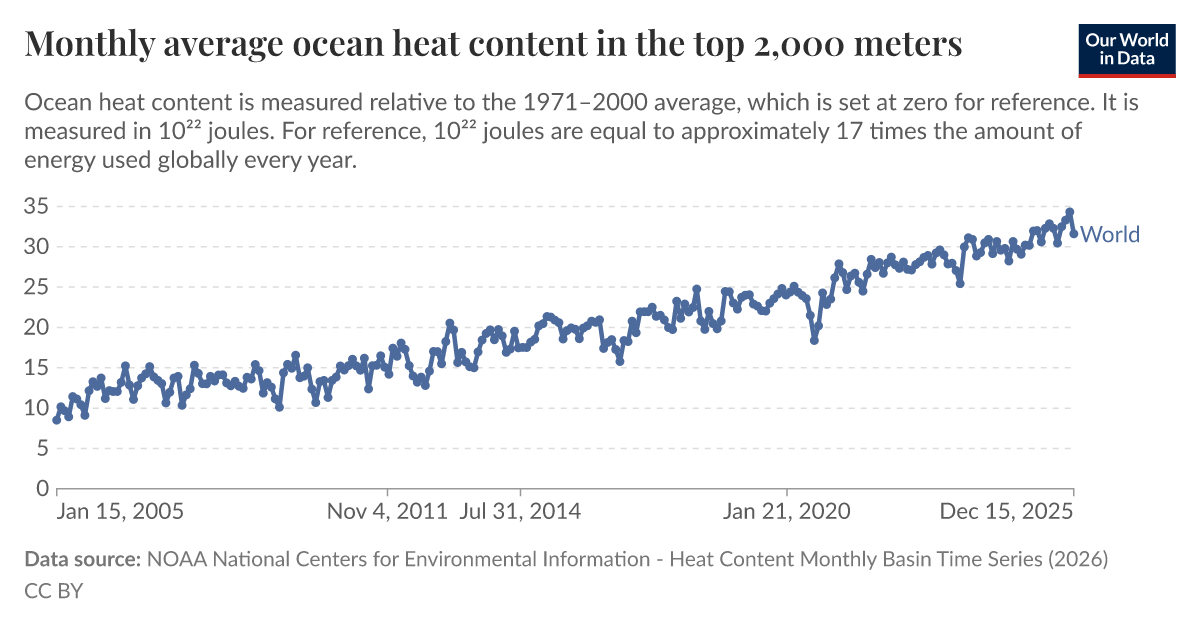
Measuring the Ocean's Warming Pulse at 2,000 Meters
Two thousand meters down, the ocean is warming measurably and without pause. Monthly average heat content in the top 2,000 meters provides one of the most empirically grounded climate indicators available, validated, peer-reviewed, and increasingly urgent. This isn't a distant signal; it is a calibrated pulse we can track in real time. Understanding drives protection. For deeper context on how global experts are building the data framework to monitor these changes, see "Global experts unite to steer Ocean Decade's data and knowledge framework."

From surface to seafloor, a calibrated global map of microplastic drift
From surface to seafloor, this calibrated global map of microplastic drift transforms scattered data into measurable ocean intelligence. It is empirical, peer-reviewed, and urgently needed. Understanding where plastics accumulate, and where they travel, is the first step toward action. For deeper context on the sources feeding this crisis, see our related coverage of how more than 1,000 rivers drive 80% of ocean plastic emissions. Protection begins with precision.

Calibrated search reveals ocean intelligence from seafloor to surface
From seafloor to surface, a calibrated search reveals ocean intelligence that is both validated and measurable, this is what NOAA's new discovery platform delivers. It transforms raw depth data into integrated, real-time insights we can trust. Understanding drives protection, and this tool makes that possible. For deeper context on why such calibrated monitoring matters, read our coverage of the proposed US cuts that risk leaving the world "flying blind."

Open Source Data Charts a Measurable Course for Global Ocean Mapping
A new open-source data framework charts a measurable course for global ocean mapping, turning fragmented observations into a coherent, integrated data ecosystem. This isn't abstract theory, it's a calibrated, peer-reviewed foundation for action. We see this as essential to building ocean intelligence. For a deeper look at how empirical data traces pollution back to its sources, see our related piece, "Tracing ocean plastic to its land-based sources via empirical data." Understanding drives protection.

Decades of Atlantic circulation data reveal measurable climate indicators
Decades of Atlantic circulation data now offer something the field has long needed: measurable, validated climate indicators. This isn't anecdotal observation, it's empirical, longitudinal evidence of change. Understanding drives protection, and this dataset from NOAA gives researchers and policymakers a calibrated baseline to measure what comes next. For deeper context on the ocean's thermohaline structure, our related work on a validated global atlas from WOA18 connects the dots between surface signals and the deep currents that drive them.

Ocean data expands from measured depths to validated insights
From orbit to ocean floor, the National Centers for Environmental Information (NCEI) transforms measured depths into validated, peer-reviewed insights. This expanding ocean of data is our most calibrated window into planetary change. Understanding drives protection. For deeper context on how these long-term records reveal accelerating shifts, see our related analysis, "Decades of Atlantic circulation data reveal measurable climate indicators." The empirical story is clear: what we measure, we can protect.

2025 Temperature Anomalies: Tracking Global Climate Indicators.
The 2025 temperature anomaly data from Our World in Data offers a measurable look at how far the climate has shifted. These annual figures are more than numbers; they are calibrated indicators of a planet in motion. We track them because understanding drives protection. The record ice gain in East Antarctica, detailed in our related coverage, reminds us that regional extremes can temporarily mask global trends. For now, the anomalies demand our attention, not alarm.
Data-Driven Ocean Biodiversity: A Path to Sustainable Stewardship.
Biodiversity data is the backbone of any meaningful effort to sustain ocean nature, yet it remains unevenly collected across the globe. Prioritizing that data is not a technical footnote; it is the foundation for measurable stewardship. We cannot manage what we cannot see. This piece examines how targeted collection efforts build the integrated data ecosystem needed for lasting impact. For broader context on how ocean data flows connect regions, our related coverage on integrated subsea cables offers a useful perspective.
Reconstructing Earth's Past Climate Through Empirical Data Analysis.
Earth's distant past is not a blank slate; it is written in layers of sediment, ice, and shell. Reconstructing Earth's Past Climate Through Empirical Data Analysis, mapped by Carbon Brief, shows how these 'proxy' records translate into measurable climate indicators. This is not speculation; it is calibrated, peer-reviewed science. Understanding these deep-time signals sharpens our view of present-day change. For a related thread on how ancient signals can be misread, see our coverage of magma and microbial activity potentially rewriting a 2-billion-year-old carbon signal.

Autonomous Vessels Chart Ocean Depths in Navy Mapping Project
The U.S. Navy's selection of Boston-based Blue Water Autonomy to map ocean floors with uncrewed surface vessels marks a practical step forward in maritime intelligence. This is not flashy technology; it is calibrated, real-time data collection that strengthens navigational safety and operational awareness. The project reflects a growing trust in autonomous systems to perform precise, sustained work where crewed vessels face greater risk.
Record Sea Surface Temperatures Highlight Urgent Climate Indicators.
The ocean is running a fever, and the latest readings from Copernicus Marine and Copernicus Climate Change confirm it: daily global sea surface temperatures have shattered records for this time of year. These aren't just numbers; they are empirical, climate indicators we can no longer ignore. The data is clear, so we must turn this measurable urgency into action.