earth science
World Data Ocean keeps earth science in one place: 5 stories so far. The section currently leads with “From orbit to ocean floor, integrated data sharpens Earth science”, “Cascadia’s Subduction Zone Reveals a Fragmented Tectonic Process”, and “2025 Temperature Anomalies: Tracking Global Climate Indicators.”. From orbit to ocean floor, integrated data sharpens our view of Earth as a single, dynamic system. Off Vancouver Island, scientists have captured a subduction zone in the act of tearing itself apart. A Global Hub for Ocean Intelligence 4 World Data Ocean is a centralized digital platform where researchers, scientists, and ocean enthusiasts converge to… The list below is every earth science story on World Data Ocean, newest first.
From orbit to ocean floor, integrated data sharpens Earth science
From orbit to ocean floor, integrated data sharpens our view of Earth as a single, dynamic system. This emerging practice in big-data Earth science promises more than incremental insight, it delivers the empirical, calibrated foundation for real action. Understanding drives protection, and this work validates that measurable ocean intelligence is within reach. For a deeper look at how these principles apply, our data-driven model of atmospherically forced ocean dynamics offers a compelling companion.
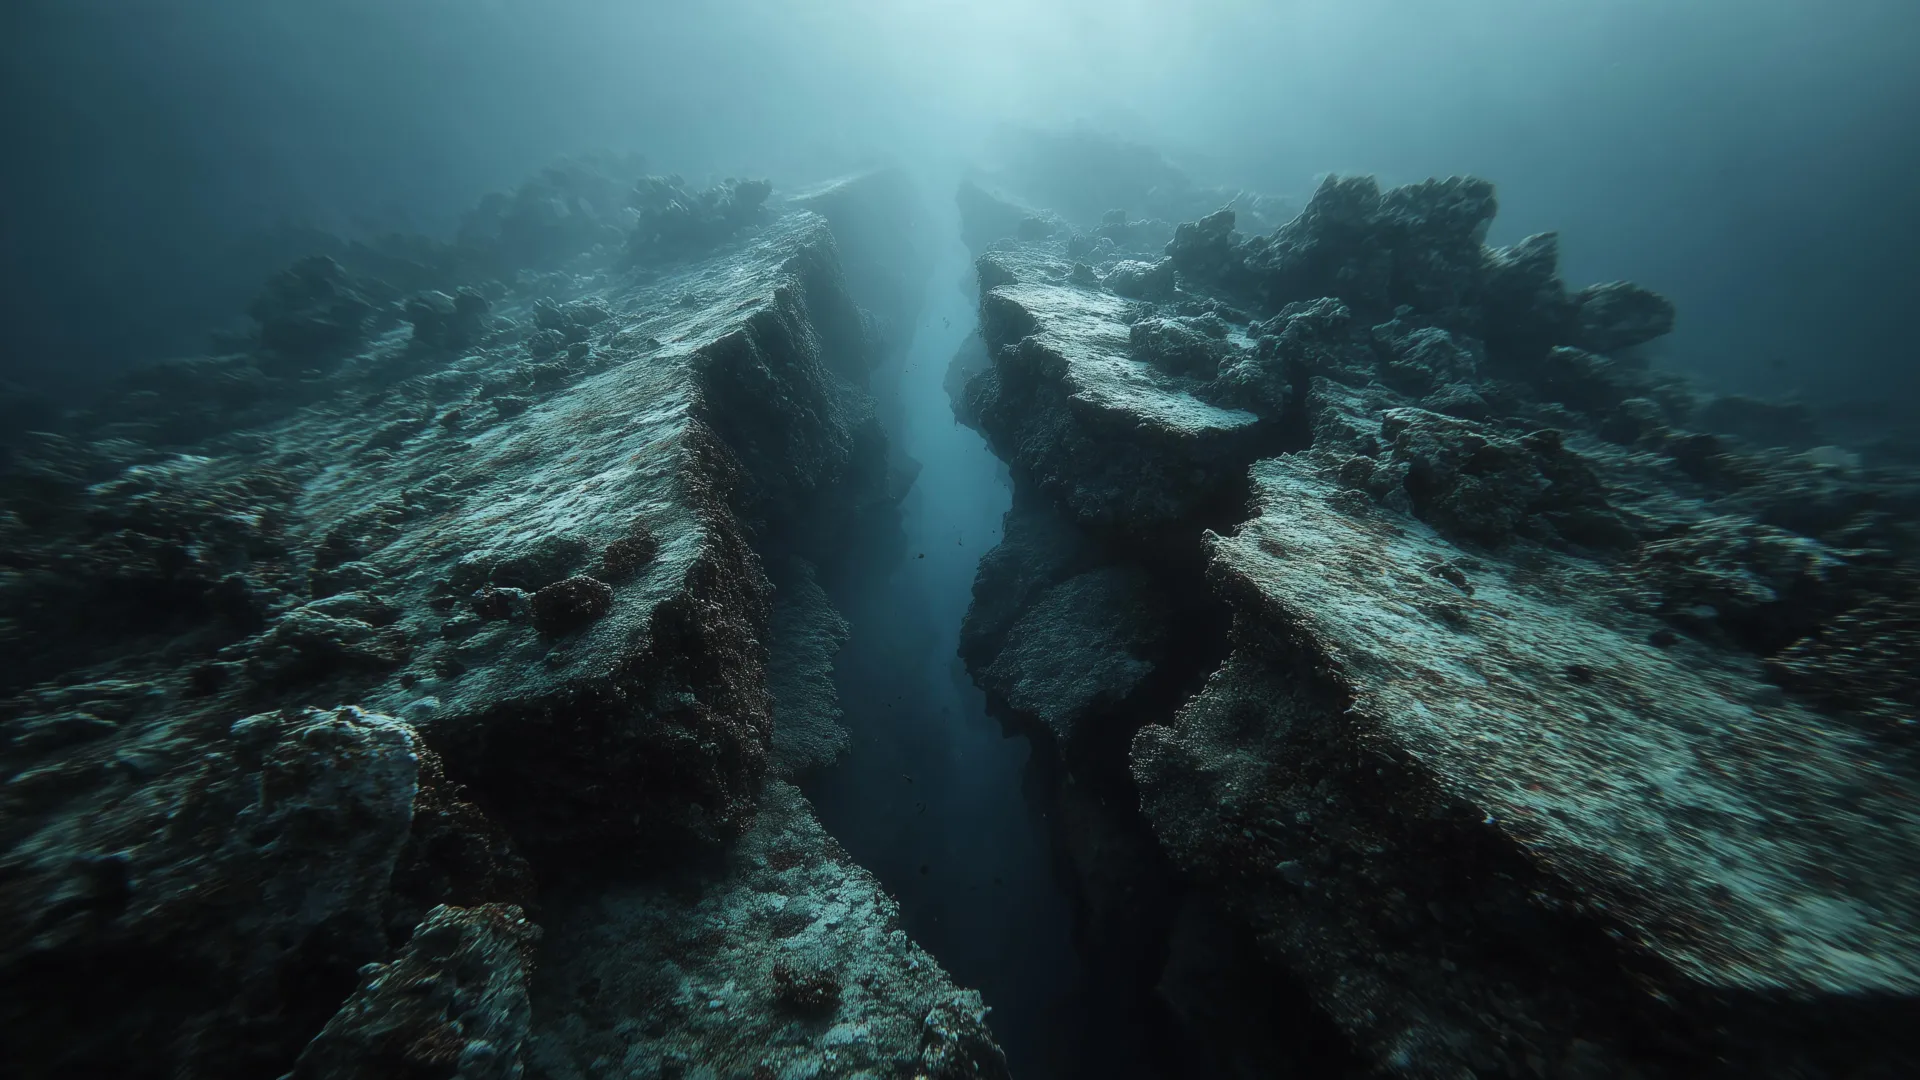
Cascadia’s Subduction Zone Reveals a Fragmented Tectonic Process
Off Vancouver Island, scientists have captured a subduction zone in the act of tearing itself apart. The Cascadia fault is not dying as a single, monolithic system. Instead, new evidence suggests it is fragmenting piece by piece. This process offers a rare window into how ancient plate fragments form and where hidden breaks might influence future seismic activity. Understanding this measured, piecemeal unraveling is key to refining our earthquake models.

2025 Temperature Anomalies: Tracking Global Climate Indicators.
The 2025 temperature anomaly data from Our World in Data offers a measurable look at how far the climate has shifted. These annual figures are more than numbers; they are calibrated indicators of a planet in motion. We track them because understanding drives protection. The record ice gain in East Antarctica, detailed in our related coverage, reminds us that regional extremes can temporarily mask global trends. For now, the anomalies demand our attention, not alarm.
Bridging Science and Stories: Engaging the Public on Ocean Challenges
A classroom of students who could define ocean acidification yet still believed geoengineering would save them: that is the gap this author set out to close. His eco-mystery uses narrative tension to make risk feel immediate, not abstract. It is a practical experiment in science communication, and one worth testing. For readers interested in how such efforts connect to broader data efforts, our piece on integrating citizen science for ocean intelligence offers useful context.
Ocean Salinity Shifts: A Longitudinal Analysis, 1955-1998
Between 1955 and 1998, the World Ocean's salinity did not drift randomly; it shifted in measurable, persistent patterns. Boyer's longitudinal analysis, published in *Geophysical Research Letters*, offers empirical weight to what we suspect about a warming planet: the water cycle is accelerating, and the ocean is keeping the score. This isn't abstract data; it is a calibrated indicator of change. For context on how we now monitor these systems, our coverage of integrated subsea cables shows the infrastructure carrying such intelligence across the Indian Ocean.